Some links in this article are affiliate links. We may earn a small
commission if you make a purchase or fund an account through these
links — at no extra cost to you. This helps fund our independent
research and testing.
For trading and crypto content specifically: information is for
educational purposes only and is NOT investment advice. Past
performance does not predict future results. Trading and crypto
involve substantial risk of loss including total loss of capital.
Crypto specifically is highly volatile and may lose 100% of value;
EU readers note MiCA regulation; US readers note rules vary by
state. Do your own research, never invest more than you can afford
to lose.
As an Amazon Associate we earn from qualifying purchases.
The launch of the SEC’s Footnote API and Bloomberg’s Data-License 2.0 in August 2026 has reshuffled the deck. The demand for clean, point-in-time data has never been higher, but most off-the-shelf feeds are crowded, arbitraged-out playgrounds. The real edge isn’t just in having a dataset; it’s in having one that others have overlooked or are processing incorrectly.
Our top picks
- Quantitative TradingCheck price on Amazon
- Dell UltraSharp 49-inch 5K monitorCheck price on Amazon
- Advances in Financial Machine LearningCheck price on Amazon
TL;DR Verdict
For most systematic traders, high-quality, parsed SEC Filings data provides the best alpha-to-integration-cost ratio in 2026. For those with deeper pockets and specialized infrastructure, Geolocation data from satellite imagery or mobile devices offers the highest potential for unique, uncorrelated signals.
Alternative Data Feeds: A Head-to-Head Comparison
| Data Feed Type | Best For | Key Strength | Main Drawback |
|---|---|---|---|
| 1. SEC Filings (Parsed Text) | Mid-frequency fundamental & event-driven strategies | High signal-to-noise ratio; point-in-time accuracy | Alpha decay in simple signals (e.g. sentiment) |
| 2. Geolocation & Satellite Imagery | Commodities, retail, industrial production forecasting | Highly proprietary alpha; difficult to replicate | Extremely high cost and complex processing |
| 3. Consumer Transaction Data | Consumer discretionary & tech sector earnings prediction | Direct read on consumer behavior | Sampling bias, privacy issues, rapid signal decay |
| 4. Web Traffic & App Usage | Forecasting subscription growth & user engagement | Good leading indicator for digital-native companies | Panel data is often noisy and not representative |
| 5. Supply Chain & Logistics Data | Industrial, materials, and transport sector analysis | Early insight into economic activity | Extremely messy, unstructured data |
How We Evaluated
We assessed these data categories based on criteria critical to a real-world quantitative trading desk, not a marketing brochure. Our evaluation focused on:
- Signal Longevity: How quickly does the alpha from a straightforward signal decay as the data becomes more widely known?
- Point-in-Time Correctness: How clean is the data? Does the feed provider properly handle revisions, delays, and as-reported values to avoid lookahead bias?
- Integration Cost: What is the true cost in dollars and engineering hours to clean, store, and integrate this feed into a production backtesting and execution system?
- Uniqueness of Insight: Does the data provide orthogonal information not already captured in price, volume, or standard fundamental data?
1. SEC Filings: The Practitioner’s Workhorse
This isn’t your grandfather’s Compustat feed. We’re talking about point-in-time, machine-readable text and structured data from 10-Ks, 10-Qs, 8-Ks, and their footnotes. With the new SEC Footnote API, parsing subtle changes in risk factors, accounting policies, or legal proceedings has become a viable source of alpha. While simple sentiment analysis is crowded, more complex NLP models that identify specific contract terms or changes in business relationships still yield results. The key is moving beyond bag-of-words models to more sophisticated techniques, a topic covered extensively in texts like Advances in Financial Machine Learning.
2. Geolocation & Satellite Imagery: The High-Cost Frontier
This is where the biggest funds play, but the barrier to entry is dropping. Think counting cars in Walmart parking lots, tracking oil tanker movements, or measuring stockpile levels at mines. The data is expensive and requires significant investment in both storage and specialized hardware (e.g., a GPU like the RTX 4090 Ti for image processing). Visualizing geospatial time-series data also requires significant screen real estate, making a large monitor like the Dell UltraSharp 49-inch 5K monitor a practical necessity, not a luxury. The alpha is real and difficult for others to reverse-engineer, but the total cost of ownership is prohibitive for all but the most well-capitalized teams.
3. Consumer Transaction Data: Handle With Care
Credit card panels and email receipt data offer a direct, high-frequency read on company sales. This was the holy grail of alt-data five years ago. Today, it’s a minefield. Signal decay is brutal, as every major pod shop has a subscription. Furthermore, the data is plagued by sampling bias (e.g., a panel might over-represent high-income online shoppers) that can lead to disastrously wrong earnings forecasts. If you use this, your edge must come from a unique way of de-biasing the panel or blending it with other, unrelated datasets.
4. Web Traffic & App Usage: The Digital Pulse
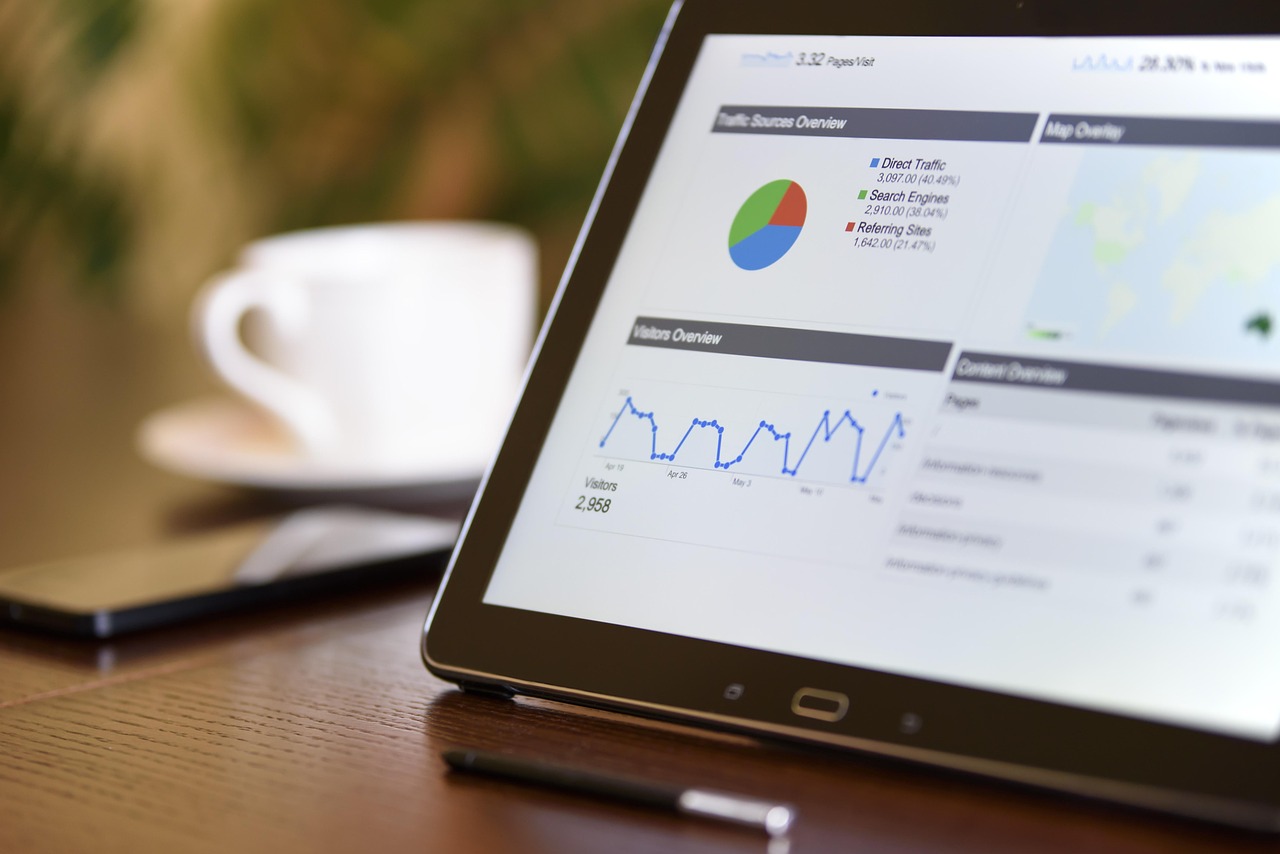
For tech, media, and e-commerce, data on website visits, app downloads, and daily active users can be a powerful leading indicator for subscriber growth and revenue. The challenge is data quality. These datasets are often derived from panels of volunteers or browser extensions, creating black boxes of potential biases. The data is often noisy on a day-to-day basis and is best used for identifying quarterly trends rather than high-frequency signals.
5. Supply Chain & Logistics: The Global Plumbing
If you want to know what a manufacturing or industrial company is *doing*, not just what it’s saying, track its shipments. Data from bills of lading, shipping manifests, and customs declarations can reveal a company’s key suppliers and customers, and shifts in activity can predate earnings announcements by weeks. The data is notoriously unstructured and requires heavy lifting to parse, clean, and map company identifiers. This is a domain where strong data engineering skills are paramount, and a solid foundation in tools covered in books like Python for Finance is non-negotiable.
Final Thoughts
The game in 2026 is less about finding a magic dataset and more about the rigorous process of cleaning, validating, and creatively combining multiple noisy sources. Start with the most robust, well-structured data you can find—like parsed filings—and build your infrastructure and expertise before venturing into the more exotic, and costly, datasets.
FAQ
Is alternative data still a source of alpha in 2026?
Yes, but the alpha is found in the unique processing of data, not in the raw data itself. Simple signals decay within months, so the edge comes from combining feeds, proprietary feature engineering, or focusing on niche markets.
What is the biggest mistake quants make with alternative data?
Ignoring point-in-time correctness and survivorship bias is the cardinal sin. Using a dataset that has been cleaned with future information will produce a fantastic backtest and a failing live strategy. Always verify your provider’s methodology.
Can a solo retail trader use these data feeds?
A solo trader can realistically access and work with parsed SEC filings or some web-scraping-based datasets. The cost of institutional-grade transaction, geolocation, or supply chain data (often k+ per year) puts it out of reach for most individuals.